
Tutorials
Tutorial 1: Features of reflectivity curves
Tutorial 2: WinSpall SPR simulation software.
Also have a look at our theory section.
Tutorial 2 - Simulate SPR curves with WinSpall
Get real: plasmons and thin layers
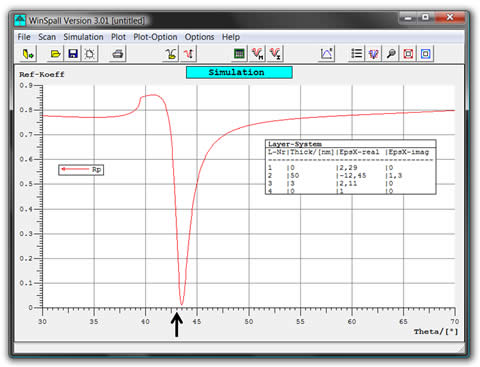 We have now added a 3nm layer on top of the gold with a dielectric constant of e'=2.11 (n=1.45) – maybe some polymer or a protein. The plasmon resonance has shifted a little. The arrow marks the previous minimum. We are now about half a degree higher.
Such a shift is easily measured and we see right away that Surface Plasmon Spectroscopy is well suited for the investigation of such thin layers.
Additionally, evaluation of the reflectivity curves is quite simple with WinSpall: all we had to do is to fill in the simulation parameter table.
Download:
Res Tec Tutorial 2 - Simulate SPR curves with WinSpall (pdf)