
Tutorials
Tutorial 1: Features of reflectivity curves
Tutorial 2: WinSpall SPR simulation software.
Also have a look at our theory section.
Tutorial 2 - Simulate SPR curves with WinSpall
Time for plasmons: let us add a some gold
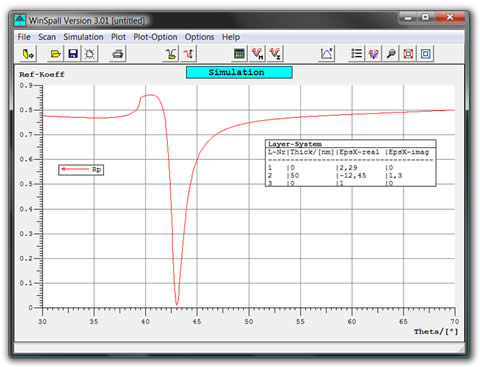 We go back to our simulation table and add an optical component between the glass and the air: a 50 nm thick gold layer with the optical constants “Eps-X real”=-12.45 and “Eps-X imag”=1.3. Those are typical values for gold but can vary to some extent due to slight differences in the evaporation process.
The reflectivity curve we get looks totally different: First, the strong increase from 0 to almost 1 around the angle of total internal reflection is much more shallow due to the reflective properties of the gold. Secondly, a surface plasmon shows up as a strong dip in reflectivity at around 43°. The entire intensity or the laser beam is now bound in this plasmon and no part of the light is reflected. This curve now describes the optical properties of a typical “blank substrate” used for surface plasmon measurements.
Download:
Res Tec Tutorial 2 - Simulate SPR curves with WinSpall (pdf)